How to track scroll depth
Tracking scroll depth helps you identify which sections of your page are most relevant to your users, allowing you to focus on the most important areas first. This approach ensures that your efforts are targeted and effective, rather than spreading yourself too thin across the entire page.
In this guide, we go over measuring scroll depth, calculating, tracking and visualizing it with Prisme Analytics.
You can check the result on our live demo.
Prerequisites
- You must have a website with default Prisme Analytics tracking working.
- You must have created a custom dashboard
Step 1: Measuring scroll depth
In order to track how depth visitors scrolls we must measure it first. There are multiple ways to so but for this guide we measure scroll percentage.
const measureScrollDepth = () => {
  const scrollEl = document.scrollingElement;
  const scrollTopMax = scrollEl.scrollHeight - scrollEl.clientHeight;
  return Math.round((scrollEl.scrollTop / scrollTopMax) * 100);
};
This function will return 100 at the bottom of the page and 0 at the top.
Step 2: Capturing scroll depth
Now that we can measure scroll depth, we must capture it each time user stop scrolling.
Browsers expose two scroll related events:
scrollevent fires when the document view has been scrolledscrollendevent fires when the document view has completed scrolling
We'll use the latter as we don't care about intermediate scroll position.
// Keep track of max scroll depth.
let maxDepthY = 0;

// Update variable each time user stop scrolling (or change scroll direction).
globalThis.addEventListener("scrollend", () => {
  maxDepthY = Math.max(maxDepthY, measureScrollDepth());
});
This code snippet updates maxDepthY variable to ensure we track up to date
value.
Step 3: Detect navigation and exits
In order to send event to Prisme, we must detect when visitor leaves page or close the tab/browser as it means it won't scroll deeper in the page.
Detecting navigation is pretty easy as browsers expose multiple events for it.
The recommended way is to listen for pagehide events that are sent to a
Window when the
browser hides the current page in the process of presenting a different page
from the session's history.
If your website is a Single Page Application (SPA) with a client side router,
then you also wants to detect when router load a new route. Client side routers
make use of the
History API and
specifically the
pushState
function. Unfortunately, there is no pushstate event so we have to hook into
History.pushState() function manually.
const sendScrollDepthEvent = () => {/* STEP 4 */};

// User navigate to other page / website.
globalThis.addEventListener("pagehide", sendMaxScrollEvent, { capture: true });

// Single Page Applications use history API for navigation.
if (globalThis.history) {
  // There is no pushstate event so we replace pushState with our function
  // that forward calls to the original function.
  const pushState = globalThis.history.pushState;
  globalThis.history.pushState = function () {
    pushState.apply(globalThis.history, arguments);
    sendScrollDepthEvent();
  };
}
This handles navigation but we still have to handle the closing tab/browser
case. Currently, there is no reliable way to detect this across browsers and
device (especially mobile devices).
MDN
recommends listening on
visibilitychange
for end-of-session analytics even though
user is still on website and may have
just switched to another tab.
globalThis.addEventListener("visibilitychange", () => {
  if (document.hidden) sendScrollDepthEvent();
});
If that don't fit your needs and truly wants to track when user closes tab /
browser, you can still use the
non recommended
beforeunload
event that works well on Chrome, Firefox and (maybe) Safari on desktop.
Step 4: Send scroll-depth Event
Finally, we can send the event to Prisme using the
trigger function.
const sendScrollDepthEvent = () => {
  // Another event already sent the event.
  if (maxDepthY === -1) return;

  globalThis.prisme.trigger(
    "scroll-depth", // Event name.
    { depthY: maxDepthY }, // Event properties.
  );

  // Prevent other event handler to send the same event twice.
  maxDepthY = -1;
};
Note that you don't need to include the date, domain or the path of the page in the object as it is automatically added by the server. Checkout custom events table schema to see all builtin properties.
It is recommended to avoid nested JSON objects as it may impact performance at query time.
Step 5: Putting it all together
Here is our final JavaScript code:
document.addEventListener("DOMContentLoaded", () => {
  const measureScrollDepth = () => {
    const scrollEl = document.scrollingElement;
    const scrollTopMax = scrollEl.scrollHeight - scrollEl.clientHeight;
    return Math.round((scrollEl.scrollTop / scrollTopMax) * 100);
  };

  let maxDepthY = 0;
  globalThis.addEventListener("scrollend", () => {
    maxDepthY = Math.max(maxDepthY, measureScrollDepth());
  });

  const sendScrollDepthEvent = () => {
    if (maxDepthY === -1) return;

    globalThis.prisme.trigger(
      "scroll-depth",
      { depthY: maxDepthY },
    );

    maxDepthY = -1;
  };

  globalThis.addEventListener(
    "pagehide",
    sendScrollDepthEvent,
    { capture: true },
  );

  globalThis.addEventListener("visibilitychange", () => {
    if (document.hidden) sendScrollDepthEvent();
  });
  // OR
  // globalThis.addEventListener("beforeunload", sendScrollDepthEvent);

  if (globalThis.history) {
    const pushState = globalThis.history.pushState;
    window.history.pushState = function () {
      pushState.apply(globalThis.history, arguments);
      sendScrollDepthEvent();
    };
  }
});
Once added to your website, you should see scroll-depth requests in the
DevTools:

That's it! You should see your custom events in the Custom Events row of your
dashboard:
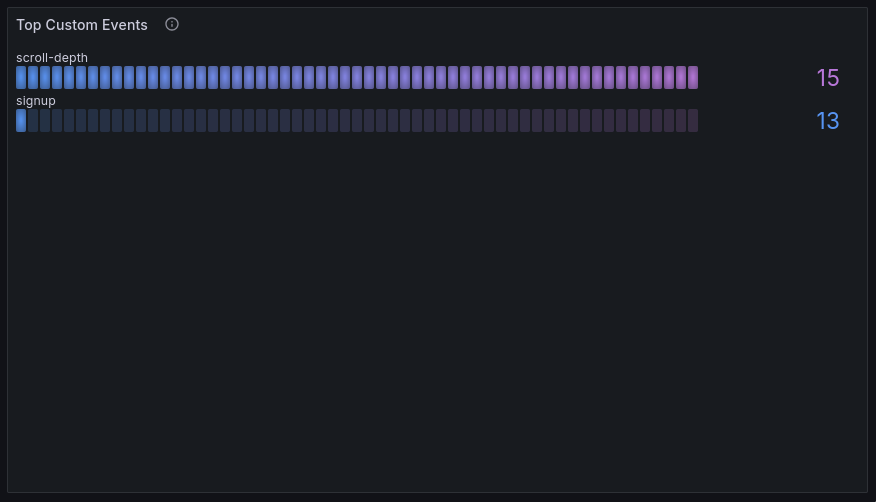
Number of scroll depth events isn't useful we need a better visualization.
Step 6: Create a new panel
Being based on Grafana, Prisme lets you create custom dashboards and panels. If you don't already have a custom dashboard, checkout this guide.
Here, we focus on building a panel to visualize scroll per pages.
Let's start by adding a new panel/visualization:
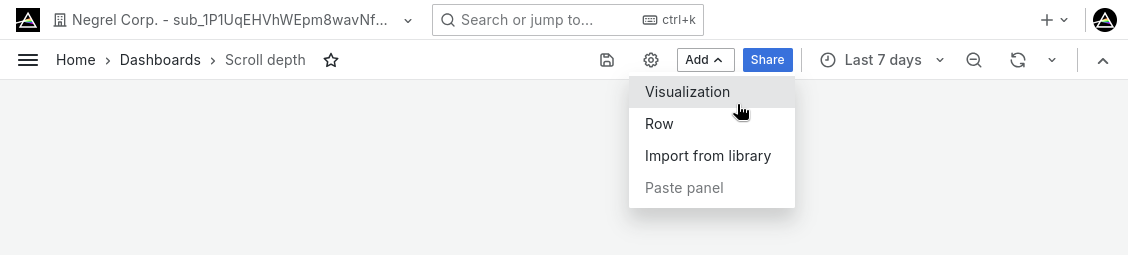
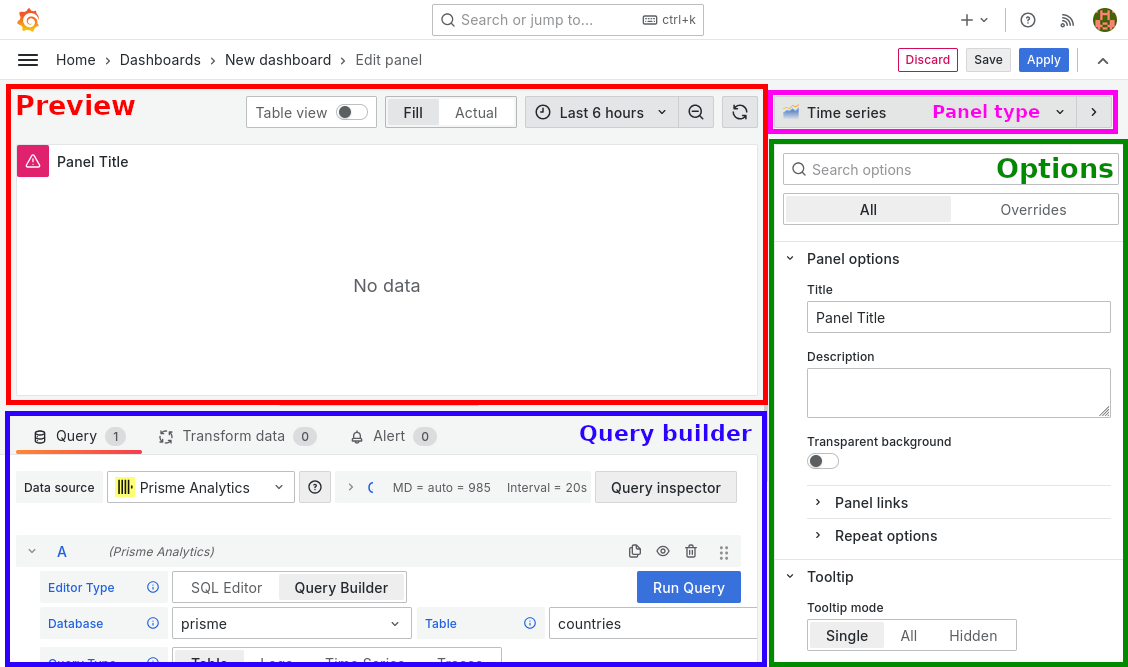
You should see a page with the following sections:
- Preview: view of panel in real time as you edit options
- Query builder: Graphical builder for easily querying data from the ClickHouse database
- Panel type: Dropdown menu with dozens of panels type
- Panel options: Standard and specific panel options
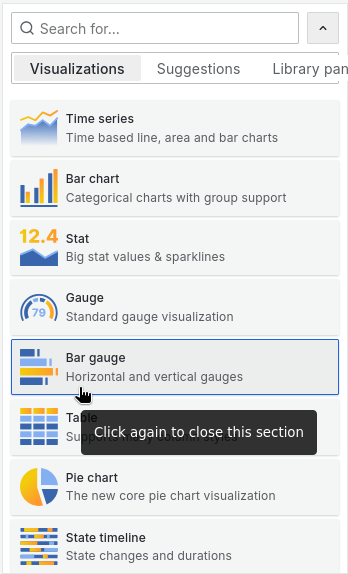
In the panel type dropmenu, select Bar gauge:
Now, in the query builder, select the SQL Editor and paste the following query:
WITH average_scroll_depth_per_pages AS (
  SELECT path, avg(toUInt8OrZero(event_property('depthY'))) AS avg_scroll_depth
  FROM events_custom
  WHERE $__timeFilter(timestamp)
  AND name = 'scroll-depth'
  GROUP BY path
)
SELECT avg_scroll_depth
FROM average_scroll_depth_per_pages
WHERE avg_scroll_depth > 0
This SQL query calculates the average scroll depth for each page on your website using a Common Table Expression (CTE). It does this by:
- Selecting the path and average scroll depth from events where the timestamp is within a certain time frame and the event type is "scroll-depth".
- Grouping results by page path.
- Storing these results in a temporary table called
average_scroll_depth_per_pages.
The main query then selects the page paths and average scroll depths from this CTE, but only includes pages with an average scroll depth greater than 0.
In Value options, set Show to All values to have a bar gauge per page. Finally in Standard options, set Unit to Percent (0-100), Min to 0 and Max to 100.
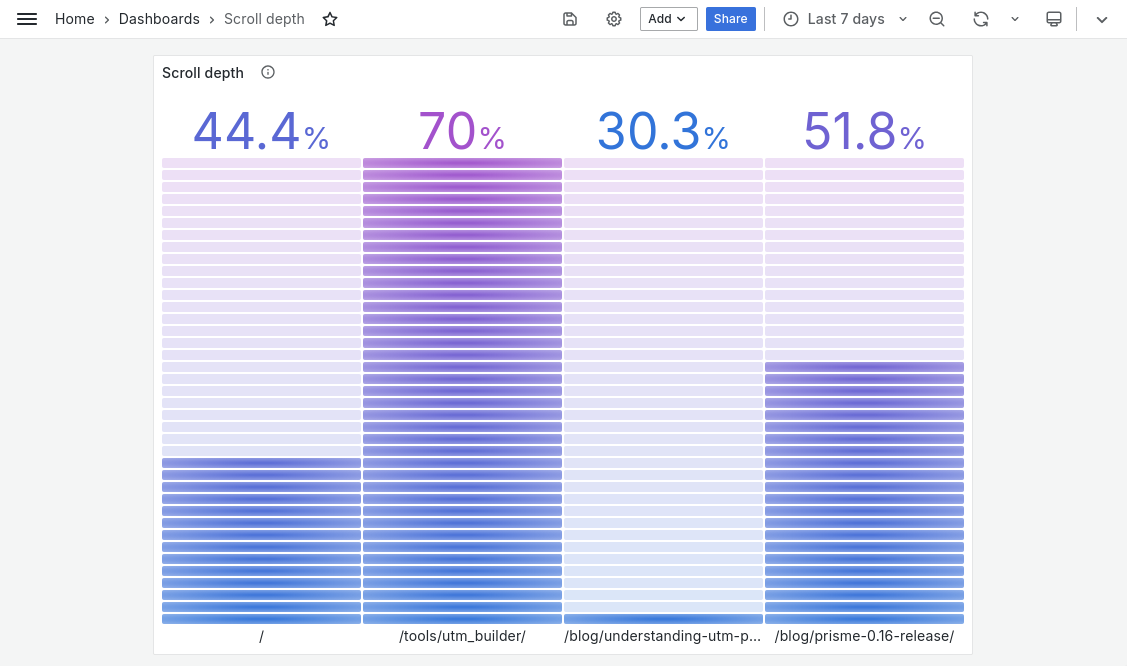
Once you’ve done this, you have scroll depth tracked and basic insights to analyze your pages. You can continue using the different properties we capture to figure out which pages are fully viewed, and which aren’t.